Inflation pressures are not easing and the Fed faces a key credibility challenge as we head into the last 3 meeting of 2022. Over deliver in this meeting or risk losing control of the wheel.
It was an eventful week in global markets following the significant beat in US core CPI, which showed continued broadening of inflation. This upended the “soft landing” narrative (of easing inflation pressures with a resilient economy) and instead provided clear evidence that the level of demand in the US economy is continuing to generate significant inflation and further tightening will be required.
The consequence was a large selloff in global interest rates (specifically the level of rates priced for the middle of 2023, with June ‘23 Eurodollars and Euribors implied yields +2.6 and +2.3 weekly standard deviation moves higher), and, a sharp fall in equities (Nasdaq down ~7% from pre-CPI levels with the largest single day fall since Mar 2020), broad strength in the USD (+2.5 weekly stdev rally from pre-CPI to Friday) and a widening in credit. Rates curves also flattened between 2023 and 2025 tenors with the spread between March 2023 and December 2025 rates seeing a 2.8 weekly stdev flattening on Wednesday.
Across assets, price action reflected the market increasing the probability of the scenario we outlined in our note at the end of August.
“The risk for equities is that Powell is approaching the point where actions will need to follow words. Current market pricing indicates the Fed as having largely finished its hiking cycle by December (13bps priced for Q1) with a final 25bp hike in Dec[ember].
Time is running out. If inflation is not falling, Powell will need to open up the probability of either larger rate hikes to Dec or hikes into 2023. This would undermine definitively that we are approaching the end of the cycle which has been a key premise of broad equity market support. Further, it will drive upside in yields well above 4.00%, which will seriously undermine long duration equities. In turn we would expect the 2023-2025 curve to flatten by 75-100bps in this scenario and equities to come under significant pressure…
The longer the equity market holds on to a belief of a soft landing and a non-hawkish Fed, the greater the pain if that reality doesn't play out. A 3.5% selloff in equity markets on hawkish comments is illustrative of this asymmetry, but it is only the opening act if the Fed needs to follow tough talk with tough action.”
Our view has been that the market has consistently overpriced the probability of a soft landing by overweighting the probability of a fall in core inflation (despite the continued strength in shelter and the labor market) and underweighting the commitment of the Fed to bring inflation down. Furthermore the “soft landing” narrative was particularly vulnerable to either leg being disproven. The inflation leg is what happened in part last week. The Fed leg may still come.
However, even with the recent selloff, the scenario of persistently high inflation and a credible Fed continues to be underpriced. There are only 3 meetings to the end of the year, and the pricing for those are 79 bps, 70 bps and 43 bps. This means that there is only 33 bps of additional upside in yields vs forwards if the Fed is capped at a maximum of a 75bps per meeting. In addition, rates pricing for the start of 2023 still shows less than 1 x 25bp hike in the first two meetings next year.
This is the challenge facing the Fed and the source of significant asymmetry in risk assets. If the Fed wants to overdeliver hawkishly vs what is priced, that means either 100bp hike in September or October or some new, clear communication that increases rate hike pricing into 2023. “Hope” is not a monetary policy strategy, and it seems clear that the rate hikes so far have done little to halt the inflation that is being generated within the economy. Therefore, the necessity for hawkish overdelivery remains.
From our perspective, a 100bp hike is warranted and consistent with recent Fed communication and is what is required to re-establish credibility. Indeed, given market pricing, equities may rally if the Fed delivers 75bps. The EM playbook is clear, a central bank who is serious about fighting inflation should tilt in favor of hawkish overdelivery rather than run the risk of any perception of dovishness. Inflation fighting favors the brave.
However, the more likely outcome is that Powell adopts a hawkish tone, with hawkish September forecasts alongside a 75bp hike, which only pushes the asymmetry a little further out on the curve. If inflation continues to be elevated in October’s data then 100bps will be back on the table and eventually we believe the pricing in H1 2023 will be challenged.
We believe this is the most underpriced scenario in markets. Without strong action from the Fed to tighten financial conditions, it is growing increasingly unlikely that we will see the type of cooling in core inflation that would allow the Fed to pause in December. In a case where hikes continue into 2023 then we expect there is 50-75bps of upside in yields in the first half of 2023, which will continue to support the USD, flatten the curve between 2023-2025 tenors and serve to undermine long duration equities such as tech stocks. If they do increase rates by 100bps on Wednesday (which they could), that repricing happens sooner and in a more volatile fashion.
Either way, the Fed faces a key challenge this week. Take the opportunity for a hawkish surprise by moving 100bps or run the risk of waiting when the cost benefits may be much worse (see our note below). The base case is more of the same, and a continuation of a data dependent market and Fed, but we view the risk of a true hawkish surprise on Wednesday as material.
US Inflation Update:
Tuesday’s August CPI report was yet another beat, with Core CPI beating expectations with a +57 bps m/m increase. The beat was broad-based, with strong increases in shelter, medical care services, personal care, and autos. Core goods accelerated to 46bps m/m, despite decelerations in PPI and import prices indices facing businesses, suggesting businesses were able to continue to push their pricing onto end consumers. On the services side, core services rose by +58 bps, led by sizable gains in the labor market-sensitive shelter and medical care services components. While energy prices continued to fall in the August report with a -5.02% m/m decline, the strength in price gains outside energy in the report suggests US demand remains high enough to validate the inflationary price-setting behavior (whether anticipatory or to 'catch-up' for lagged real income losses) that has become pervasive in recent months.
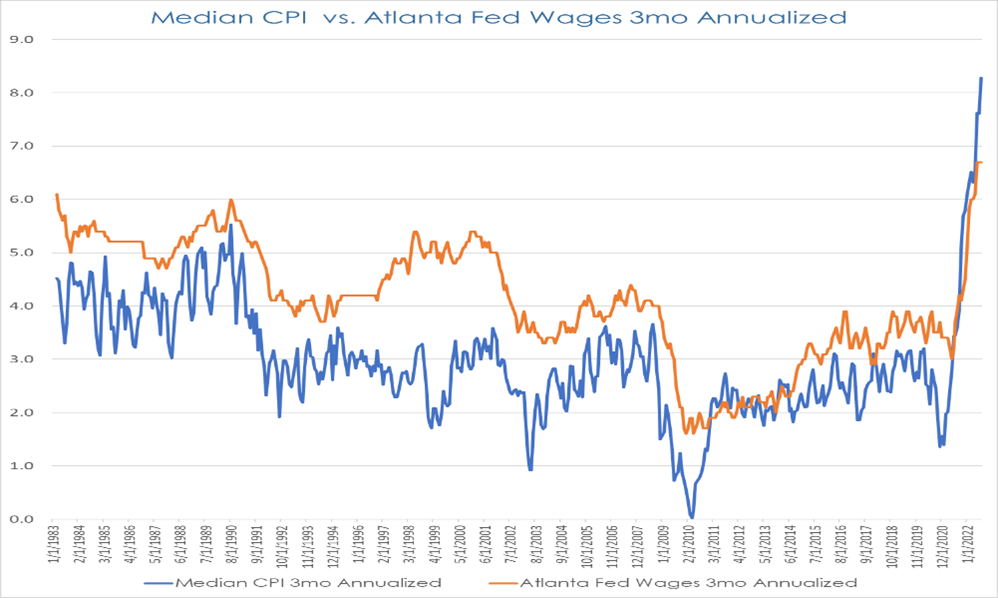
The breadth of the August report strength pushed m/m Median CPI inflation to a new series high in August. As the chart below comparing the annualized 3ma growth in Median CPI and the Atlanta Fed’s wage tracker illustrates, the US continues to face the most broad-based wage & price pressure since Volcker.
A key driver of Tuesday’s inflation surprise was a further acceleration in OER to 0.71% m/m - a new cycle and multi-decade high. As the left-hand chart below illustrates, the recent strength in shelter inflation has helped take the torch from other Core components to lead inflation higher in recent months. While some commentators have pointed to the cooling in for-sale US house prices and a deceleration in the growth of ‘spot’ asking rents, we are skeptical that rental inflation will fall much below it’s current 6.3% YOY rate in the next couple of years without a material weakening in wage growth and the unemployment rate.
First, while the pace of acceleration in ‘spot’ asking rents has indeed slowed - we believe the CPI indices are still a long way from fully reflecting the rental market repricing that has occurred over the last few years. This can be illustrated in the middle chart below, which shows the acceleration/deceleration of Corelogic’s Single-Family rental price index YOY (advanced 12 months) relative to OER YOY The lead/lags typically seen with the Corelogic data suggest OER is on pace to keep accelerating well into the middle of next year. Additionally, the final chart to the right shows, an average of Zillow and ApartmentList rental prices over the last three years have increased at a ~7% CAGR compared to just +4.1% for the lagging and more smoothed CPI rental indices.
Second, we also see today’s slowdown in house prices as less predictive of a rental slowdown in this cycle than in the GFC cycle. While house price declines in the GFC cycle did lead rental deflation - that cycle’s house price declines were driven more by a mortgage credit availability shock, an imbalance between household formations and housing completions (completions > household formations) even before the labor market deterioration, and a flood of distressed rental supply from foreclosures associated with risky mortgage structures (foreclosures became rental supply).
In contrast, today’s slowdown in house price growth is related to a mortgage affordability shock that is pricing prospective new homebuyers out of the competing for-sale market (for-sale housing is a ‘substitute good’ to the rental market), the US is underbuilding relative to household formations and has been for over a decade (this is unlikely to change without a weak labor market), and there is limited distressed mortgage supply due to changes mortgage structuring/underwriting post-GFC and stronger homeowner balance sheets. In this cycle, with underbuilding relative to household formations and strong homeowner balance sheets, the mortgage affordability shock may even tighten rental markets further by raising the barriers for rental market participants to make the transition to homeowners.

Tuesday’s inflation report at 0.57% m/m Core and Thursday's 213,000 initial claims report should be clarifying about where the balance of risks lies for the Fed - even with FCI and monetary tightening shocks, gas price deflation, US dollar strength, and a domestic and international growth slowdown, the US economy remains imbalanced with strong inflationary inertia and aggressive price-setting behavior permeating the US economy. While lagging shelter pressures contributed to Tuesday’s beat, we believe shelter inflation will remain a major contributor to US inflation over the next year, with a slowdown to pre-pandemic rent growth norms in the next 18 months likely requiring meaningful weakening in labor markets.